The Frank Value Fund Institutional class returned 13.60% YTD 2026, compared to 17.58% for the Russell Midcap Value Index. Since fully integrating catalyst-unlocking value into the strategy in January 2022, Frank Value Institutional class produced a total return of 83.20%, outperforming the Russell Midcap Value ETF return of 45.04% and the S&P 500 ETF return of 67.13%. For the five years ended June 30, 2026, the Frank Value Fund Institutional class ranked in the top 7% of its Morningstar category, Mid-Cap Value. Please see the end of this letter for more performance information.
Diversified Index it is Not
Investors who believe an investment in the S&P 500 adequately diversifies their equity exposure should examine the chart below. Indices are prone to massive distortions, especially during times of market frenzies. With 41% of the S&P 500 concentrated in the "AI Big 10," the index's current makeup is comparable to historical market peaks. At the peak of the tech and telecom bubble in 2000, the hottest stocks of the day also comprised 41% of the S&P 500. From March 2000 to March 2010, the S&P 500 experienced a "lost decade," suffering a negative return for the ten-year period and severely impairing investors' retirement plans and long-term goals.
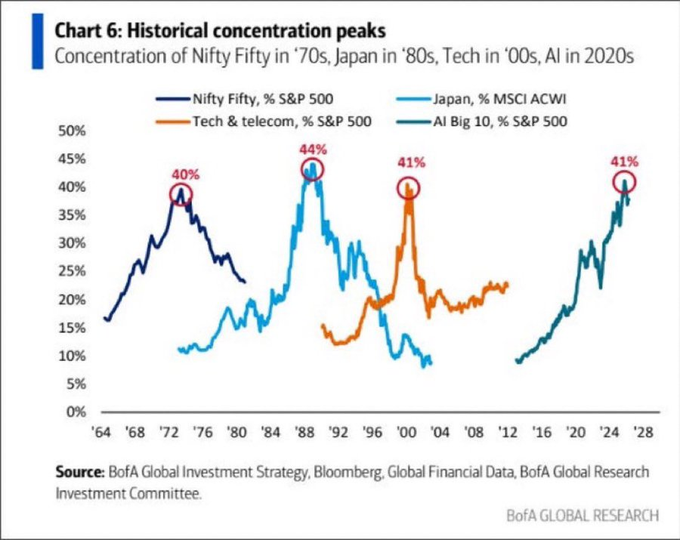
Rather than make the impossible "it's a bubble" call, we prefer a simple point: avoid concentrating 41% of your assets in a highly correlated, potentially over-valued bet. The Cyclically Adjusted P/E (CAPE) is over 41x, which is just shy of the all-time high of 44x in November 1999. If you think outside the indices as the Frank Value Fund is designed to, there are plenty of opportunities trading at 10x earnings or less. None of them, however, are in the "AI Big 10." An investment in Frank Value Fund can significantly diversify an index portfolio thanks to the fund's minimal overlap with any index or ETF.
The Historical Opportunity in Consumer Staples
This chart shows the last time technology vastly outperformed consumer staples. You guessed it, the tech and telecom bubble in 1999-2000 peaked around a 66% performance differential between tech and consumer staples plus financials. History may not repeat itself, but it certainly rhymes here. Fabulous companies with long-term competitive advantages like Hershey's and Post Holdings continue to produce predictable free cash flow as their stock prices languish. Chocolate chips lack the excitement of computer chips, but investors are getting far more cash from the former.
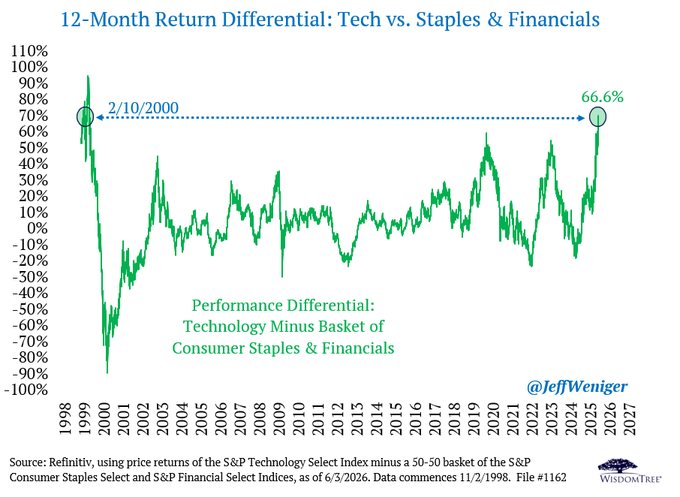
Just as the extreme expectations of high valuations sow the seeds of under-performance for technology stocks, the glaringly low valuations of consumer staples allow management teams to repurchase material amounts of stock, further accelerating earnings per share growth in the years ahead. Accelerating earnings growth typically catalyzes stock price increases. We believe the same playbook is occurring today with consumer staples. If you follow the chart from February 2000, you can see technology underperforming nearly 90% in the few months following peak mania. While a repeat of that would be a phenomenal outcome for Frank Value Fund shareholders, merely a return to average performance on both tech and staples would be a significant benefit.
Frank Value Fund retained its large position in consumer staples stocks, while adding healthcare companies and defense contractors during the second quarter. These businesses are so undervalued that their management teams can return over 10% of capital to shareholders annually. Rather than underwriting complex unknowns like margins on DRAM in 2030, we merely need people to continue to enjoy Hershey Bars and Reese's Peanut Butter Cups, take care of their health, and for the US government to continue military spending. Those seem like easy bets compared to who wins the AI frontier model race, whether semiconductors remain a violently cyclical industry, or which tech giant will accrue the spoils of this AI capital spending war.
What's Next
Cracks have appeared in the previously unassailable armor of the hottest stocks in the market. As capital has recently fled momentum, value has benefited, but investors are conditioned to buy every dip. We believe the market will inflict maximum pain on undisciplined, "fear of missing out" technology investors by rewarding dip-buying behavior until the last dollar has been allocated. Market topping is a long process, but the value-releasing catalysts in the Frank Value Fund portfolio continue to unlock returns for our shareholders.
Sincerely,
Brian Frank
Frank Value Fund Portfolio Manager
| Performance as of 6/30/26 |
Total Return % | Average Annualized Total Returns % | |||||||
|---|---|---|---|---|---|---|---|---|---|
| 2026 | 2025 | 2024 | 2023 | 2022 | 3 Yr. | 5 Yr. | 7 Yr. | Since 7/21/04 | |
| Frank Value Fund Inst'l | 13.60 | 12.29 | 19.45 | 15.13 | 4.43 | 17.61 | 12.64 | 12.49 | 7.69* |
| Russell Midcap Value Index | 17.58 | 11.06 | 13.07 | 12.71 | -12.03 | 16.51 | 9.48 | 11.35 | 10.06 |
* Represents an estimate based on the performance of the Fund's Investor share class, adjusted for fees.
← Back to NewsPerformance data quoted represents past performance and does not guarantee future results. The investment return and principal value of an investment will fluctuate so that an investor's shares, when redeemed, may be worth more or less than their original cost. Current performance may be lower or higher than the performance data quoted. You may obtain performance data current to the most recent month-end by calling the Fund at 1-888-217-5426 or visiting our website at www.frankfunds.com. Returns include reinvestment of any dividends and capital gain distributions.
Non-FDIC insured. May lose value. No bank guarantee. The Fund's investment objectives, risks, charges and expenses must be considered carefully before investing. The prospectus contains this and other important information about the Fund, and it may be obtained by calling 1-888-217-5426. Please read it carefully before you invest or send money.
This publication does not constitute an offer or solicitation of any transaction in any securities. Any recommendation contained herein may not be suitable for all investors. Information contained in this publication has been obtained from sources we believe to be reliable, but cannot be guaranteed.
The information in this portfolio manager letter represents the opinions of the individual portfolio managers and is not intended to be a forecast of future events, a guarantee of future results or investment advice. Also, please note that any discussion of the Fund's holdings, the Fund's performance, and the portfolio managers' views are as of July 7, 2026 and are subject to change without notice.